
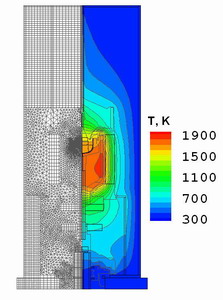
 Fig. 1.
The combined computational grid for the global heat computations
in the furnace and temperature distribution.
|
Cz growth of the SiGe crystals
Using CGSim software, the Cz growth of the Si1-xGex crystal with 3 at% initial melt Ge content was considered [1]. An important distinction of the Si1-xGex growth is that the germanium concentration changes in the melt and the crystal due to the segregation. This phenomenon is accounted for in the computations, so that the physical properties vary with the crystal height.
The combined computational grid of approximately 15000 finite volumes
(FVs) for the global heat computations and temperature distribution
in the furnace is presented in Fig.1. Here, the difference between
isotherms is 100 K, and the maximum temperature is about 1850 K. The
temperature of the outer wall was assumed to equal to 300 K. The power
of the heater was slightly adjusted to provide the desired crystallization
rate.
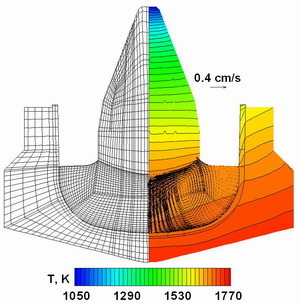 Fig. 2.
The grid for the crystallization zone (left),the temperature distribution
and the averaged melt flow pattern obtained by the 2D computations (right).
|
Detailed analysis of the crystallization zone has been made within the Reynolds averaging approach (2D computations) and 3D unsteady computations. The two-dimensional computation considers turbulent mixing using the Chien turbulence model. The computational grid for the crystallization zone (left), temperature distribution and the averaged melt flow pattern (right) are presented in Fig.2. One can see that 2D approach predicts an active downward motion along the axis of symmetry.
However, the real melt flow is three-dimensional
and unsteady; so, only 3D computations can provide comprehensive
information about the unsteady flow behavior and heat mixing in the
melt. The computational grid for 3D computations contains about
150000 FVs (Fig.4). Examples of the instantaneous flow patterns
obtained by the 3D computation are presented in Fig.5. One can see
that the melt flow has a complex structure. The highest melt velocity
at the center is about 1 cm/s, the characteristic velocity on the
melt periphery is about 1mm/s.
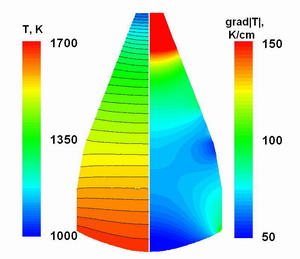 Fig. 3.
The distributions of the temperature(left) and the temperature gradient
(right) in the crystal.
|
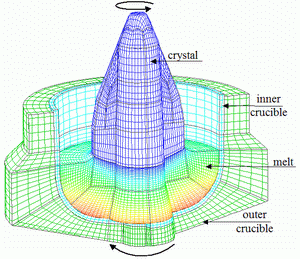 Fig. 4.
The computational grid for 3D computations contains about 150000 FVs.
|
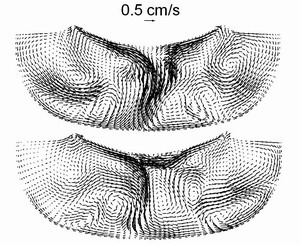 Fig. 5.
Examples of the instantaneous flow patterns obtained by the 3D computation.
|
It is interesting that the crystallization rate averaged over the crystallization front fluctuates because of melt turbulent pulsations, which affects growth stability. The fluctuations were numerically found to have the amplitude of about 1.2 mm/h. This result can be obtained only in 3D unsteady computations and explained the fact that a stable crystal growth is possible for this growth system only if the averaged pulling rate is higher than 1 mm/h.
An important parameter of bulk crystal growth is the geometry of
the crystallization front, which influences the defect formation and
impurity incorporation. The front geometry is sensitive to any changes
in the system and can be used as a criterion of simulation adequacy.
The crystallization front geometry is computed by the 3D and 2D approaches
accounting for the melt flow. Besides, the effective conductivity model,
which neglects melt convection effect, has also been used for the
melt-crystal interface geometry computations. The conductivity model
provides a smaller front deflection than the 2D and 3D flow models and
has a lager disagreement with the experimental shape. One can see that
the interface obtained in the 3D simulation is closer to the experimental
data than that provided by the 2D approach. So, the melt flow consideration
yields a more accurate description of the physical processes in the system
and gives an adequate crystallization front geometry.
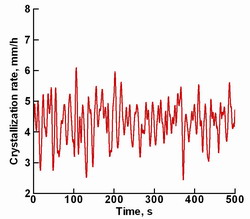 Fig. 6.
The fluctuations of the crystallization rate averaged over the
crystallization front.
|
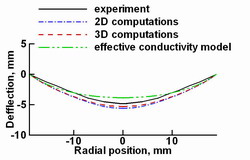 Fig. 7.
The computed and experimental crystallization front shapes.
|
References
[1] O.V. Smirnova, V.V. Kalaev, Yu.N. Makarov, N.V. Abrosimov,
H. Riemann, J. Crystal Growth 266 (2004) 74-80.